Execution History
Execution History gives you a detailed log of every workflow run: what happened, when, and what data flowed through each node.
Accessing execution history
Two ways to get there:
- From the canvas: click the clock icon in the bottom bar
- From the sidebar: click Monitor → Execution History
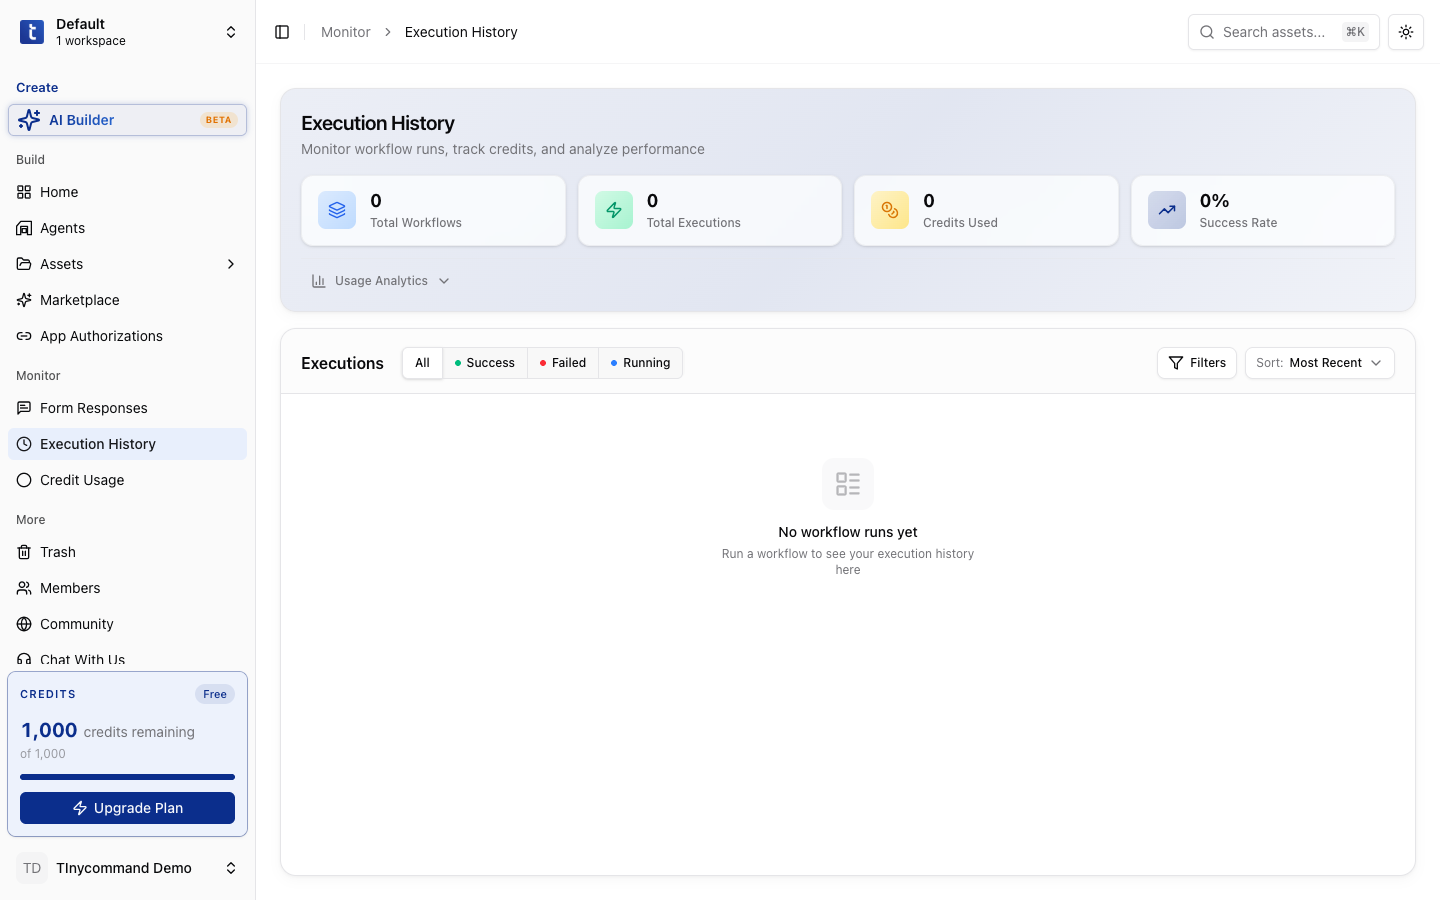
The execution list
Each row shows one workflow run:
| Column | What it shows |
|---|---|
| Status | Success (green), Failed (red), or Running (blue) |
| Workflow | Which workflow ran |
| Triggered at | When the run started |
| Duration | Total execution time |
| Credits | Credits consumed by this run |
Filtering runs
Use the status tabs to filter:
- All: every run
- Success: completed without errors
- Failed: stopped due to an error
- Running: currently in progress
Execution details
Click any run to see the per-node breakdown:
- Node timeline: which nodes ran, in what order, how long each took
- Input/Output: the exact data each node received and produced
- Errors: detailed error messages for failed nodes
This is your primary debugging tool. When something goes wrong, the execution detail shows exactly which node failed and why.
Export execution data for compliance or audit purposes. The full input/output for every node is stored and queryable.
Reading execution details
Click any run to see the full breakdown:
Node timeline
A visual timeline showing each node that ran, in what order, and how long each took. Nodes are color-coded:
- Green: completed successfully
- Red: failed with an error
- Gray: skipped (e.g., the other branch of an If-Else)
- Blue: currently running (for in-progress executions)
Per-node input/output
Click any node in the timeline to see:
- Input: the exact data the node received from previous nodes
- Output: the exact data the node produced
- Duration: how long the node took to execute
- Error: if the node failed, the full error message and stack trace
This is your primary debugging tool. When something goes wrong, start from the failed node and work backward through the inputs to find where the data went wrong.
Replaying runs
You can re-run a failed execution with the same trigger data. This is useful for debugging and fixing issues without waiting for a new trigger event.
Filtering and searching
| Filter | Options |
|---|---|
| Status | All, Success, Failed, Running |
| Sort | Most Recent, Oldest First |
| Filters | Additional filter criteria |
Credit tracking
Each execution shows the credits consumed. This helps you identify which workflows cost the most and optimize accordingly.
Check execution history after deploying a new workflow to verify it's running correctly. The first few runs are critical: catch errors early before they affect production data.
Execution history stores full input/output data for every node. For workflows processing sensitive data (PII, financial), be aware that this data is visible to all workspace members.