A database your whole team
can actually work in.
TinyTables gives your data a real home. Link tables together, let the numbers add themselves up, and see the same records as a grid, a board, a calendar or a Gantt chart. It is also the place every form, workflow and agent you build writes its rows into, so the data you collect is a live record you own. No rented Airtable. No copies in someone else's tool.
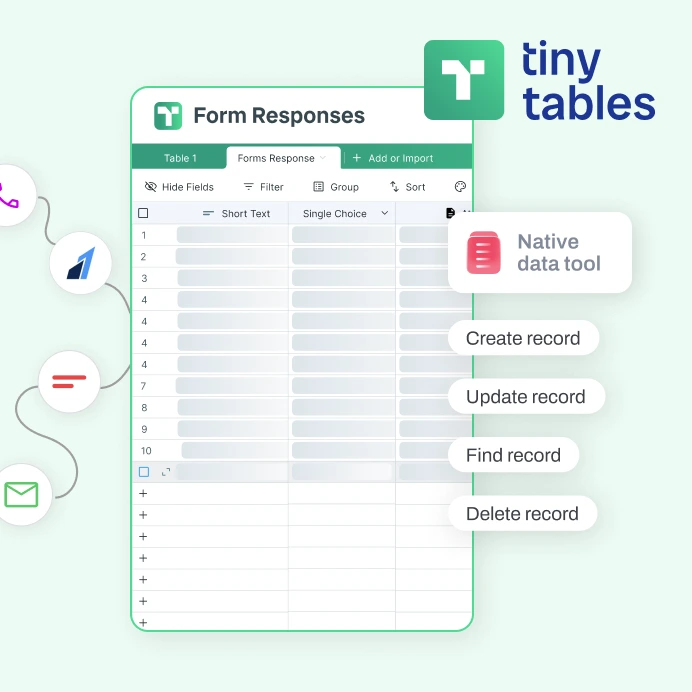
Thirty-plus kinds of column, not just text and number.
Link, lookup, rollup, formula, an AI column and enrichment sit right next to rating, currency, address, signature and file attachment. Real columns that hold real data, not cells you keep tidy by hand.
Tables that know about each other.
Connect a Deals table to a Companies table once. From then on, every deal shows its company's details and every company shows the running total of its deals. No copy and paste, and no formulas you have to keep up by hand. This is the single biggest reason to pick this over a spreadsheet.
| Company | Open deals | Pipeline |
|---|---|---|
| Northwind | 3 | $48,000 |
| Acme Robotics | 2 | $31,500 |
| Harbor Labs | 1 | $12,000 |
| Deal | Company | Amount |
|---|---|---|
| Q3 rollout | Northwind | $22,000 |
| Pilot expansion | Northwind | $18,000 |
| New region | Acme Robotics | $31,500 |
The Pipeline column adds up every linked deal for that company, and it updates the moment an amount changes.
One set of rows, every way to look at it.
Nobody has to duplicate the data to get a different view. The sales team sees a board, the project lead sees a Gantt chart, the designer sees a gallery, all off the same rows. Switch the view, not the data.
A spreadsheet's brain, inside a real database.
Write a formula across your columns and every column can show its own running totals at the bottom. The answers are right there, so you never export to a separate sheet to get them.
Everyone on the same live record.
You see each other's cursors, changes appear as they happen, and you can leave a comment right on a record. No more emailing a spreadsheet around and wondering which copy is the real one.
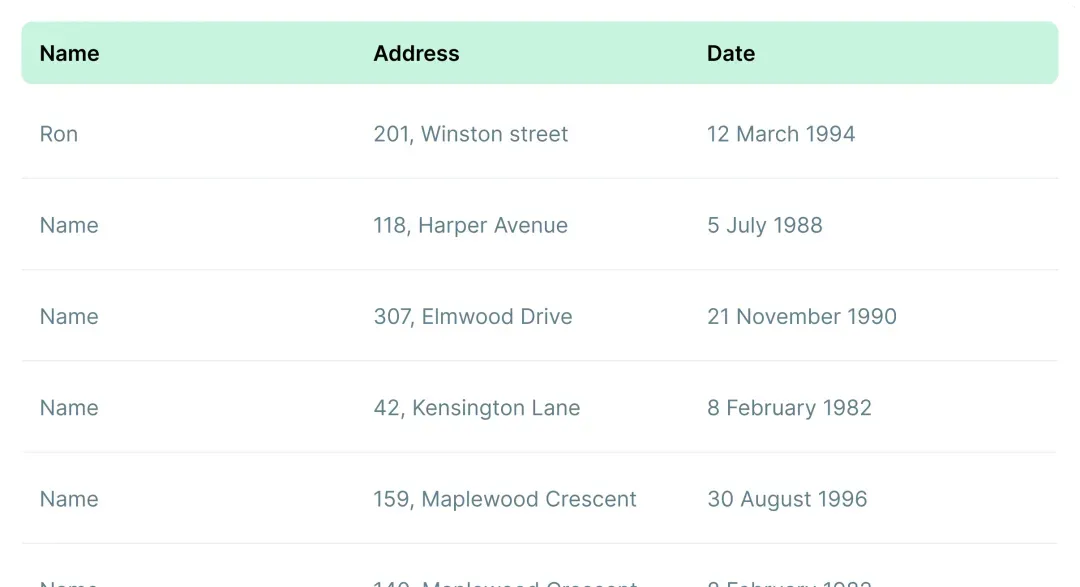
The home base for everything you build.
When a form gets a response, a workflow runs, or an agent does its job, the result is a row in your own table. One source of truth, owned by you. No separate database to rent, no connector tax, no data living in two places at once.
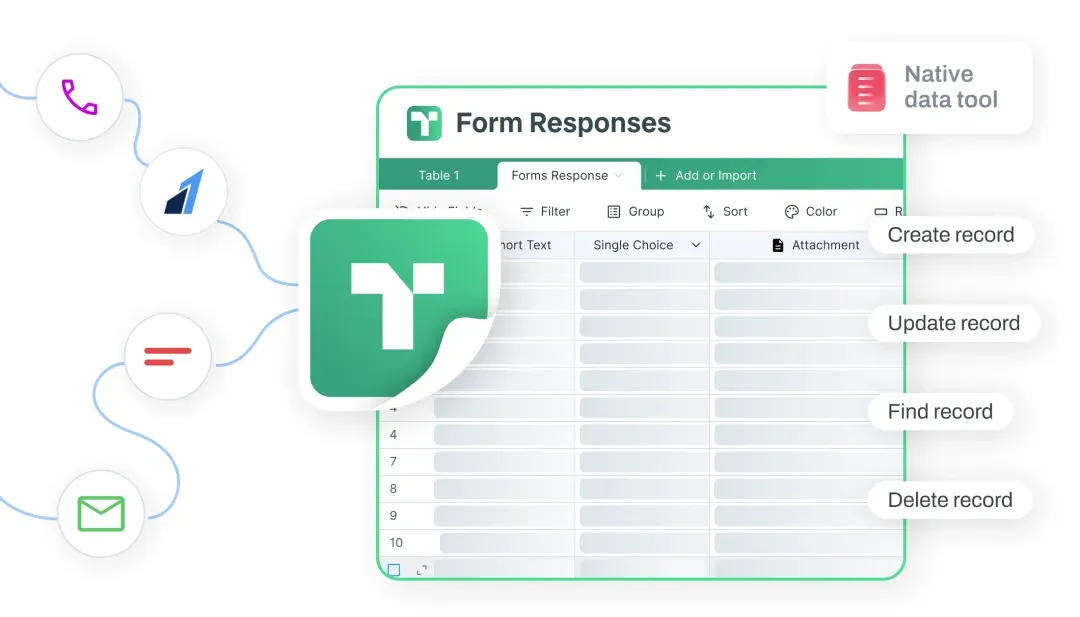

A form response lands as a live row in your table the moment someone hits submit.

A workflow can look a row up, change it, or add a new one as it runs.
An agent reads the same rows and writes back what it finds out. One place, no copies.
Bring your data in, organize it your way.
Import the list you already have, then shape it the way that makes sense to you. Filter to the rows that matter, group them, sort them, and color a row when it needs attention. You are set up fast and looking at exactly what you need.
| Name | Stage | Owner |
|---|---|---|
| Northwind | Hot | AR |
| Acme Robotics | Warm | JL |
| Harbor Labs | Hot | MK |
Import a CSV or Excel file and your columns come in typed and ready, not as a wall of plain text.
Narrow to the rows that matter, group them by stage or owner, and sort by anything.
Set a rule and a row turns green, or red, on its own so the right ones stand out.
Where it fits next to the tools you know.
Everyone here stores rows well. The difference is having a real linked database that the rest of your tools write straight into, instead of a sheet on one side and a database on the other.
| TinyTables | Airtable | Google Sheets | Smartsheet | Notion | |
|---|---|---|---|---|---|
| Linked tables, lookups and rollups | ✓ | Yes | via formulas | via references | Yes |
| Many ways to see one set of rows | ✓ | Yes | mostly grid | several | Yes |
| Formulas with totals at the bottom | ✓ | Yes | Yes | via summary | basic |
| Work together in real time | ✓ | Yes | Yes | Yes | Yes |
| The home your forms write into | ✓ | No | No | No | No |
| Your workflows and agents read and write it | ✓ | No | No | No | No |
If you want the deepest app ecosystem today, Airtable has the edge. If you just need a sheet everyone already has open, Google Sheets is unbeatable. If you want a real database that links your rows together and is the one place your forms, workflows and agents write into, that is what we built.
Good to know.
Is this a real database or just a spreadsheet? +
A real database. You can link a row in one table to rows in another, and links work both ways automatically, so a company shows its deals and each deal shows its company. Lookup and rollup columns pull and total values across those links, and everything that depends on them updates on its own when the numbers change.
How many ways can I see my data? +
Six, all off the same set of rows with nothing copied: Grid, Kanban, Calendar, Gallery, Gantt and Form. The sales team can live in the board while the project lead lives in the Gantt view.
Can my whole team work in it at once? +
Yes. You see each other's cursors, changes show up live as people type, rows and columns reorder for everyone at once, and you can comment right on a record. It feels like one shared document, not a file you pass around.
How does it connect to the rest of TinyCommand? +
It is the place the other products write into. Your forms, workflows and agents create, update, find and delete rows for you, so a form response is a live row you own and the next step can pick it right up. No rented database in the middle and no connector tax.
Can I import and export my data? +
Yes. Import a CSV or Excel file to start a table, and export any table to CSV, Excel or PDF whenever you like.
Is there a free plan? +
Yes. Start a table, bring your data in, and put your team to work for free. You are in the grid in under a minute.
Design one email and send it to your whole list.
No wiring to build between tools. Each step picks up where the last one left off.
 01TinyTables
Start with the list you keep, gaps filled in
enriched 02TinyEmails
AI builds the email, you refine it
designed 03TinyCampaigns
Sends it to the table, filled in for each person
opens and clicks reported
All it takes is a TinyCommand.
11 products. One system. One place everything lands.
Give your data a home your team can work in.
Link it, total it, see it every way, and let your forms and agents write into it. Free to start.