Running & Debugging
TinyWorkflows provides real-time execution visualization and detailed logs so you can test, debug, and monitor your workflows.
Running a workflow
Three ways to run a workflow:
| Method | When to use |
|---|---|
| Run button | Click Run in the bottom bar to run the workflow with the current trigger |
| Trigger fires | The workflow runs automatically when a webhook hits, a schedule ticks, or a manual trigger is clicked |
| API call | Trigger the workflow programmatically via the API |
Execution Visualizer
When a workflow runs, each node lights up in real-time showing its status:
- Blue: currently executing
- Green: completed successfully
- Red: failed with an error
- Gray: skipped (e.g., the other branch of an If-Else)
Click on any node during or after execution to see its:
- Input: what data it received
- Output: what data it produced
- Duration: how long it took
- Error: the error message if it failed
Execution History
View all past runs in the Execution History screen (click the clock icon in the bottom bar, or go to Monitor → Execution History in the sidebar).
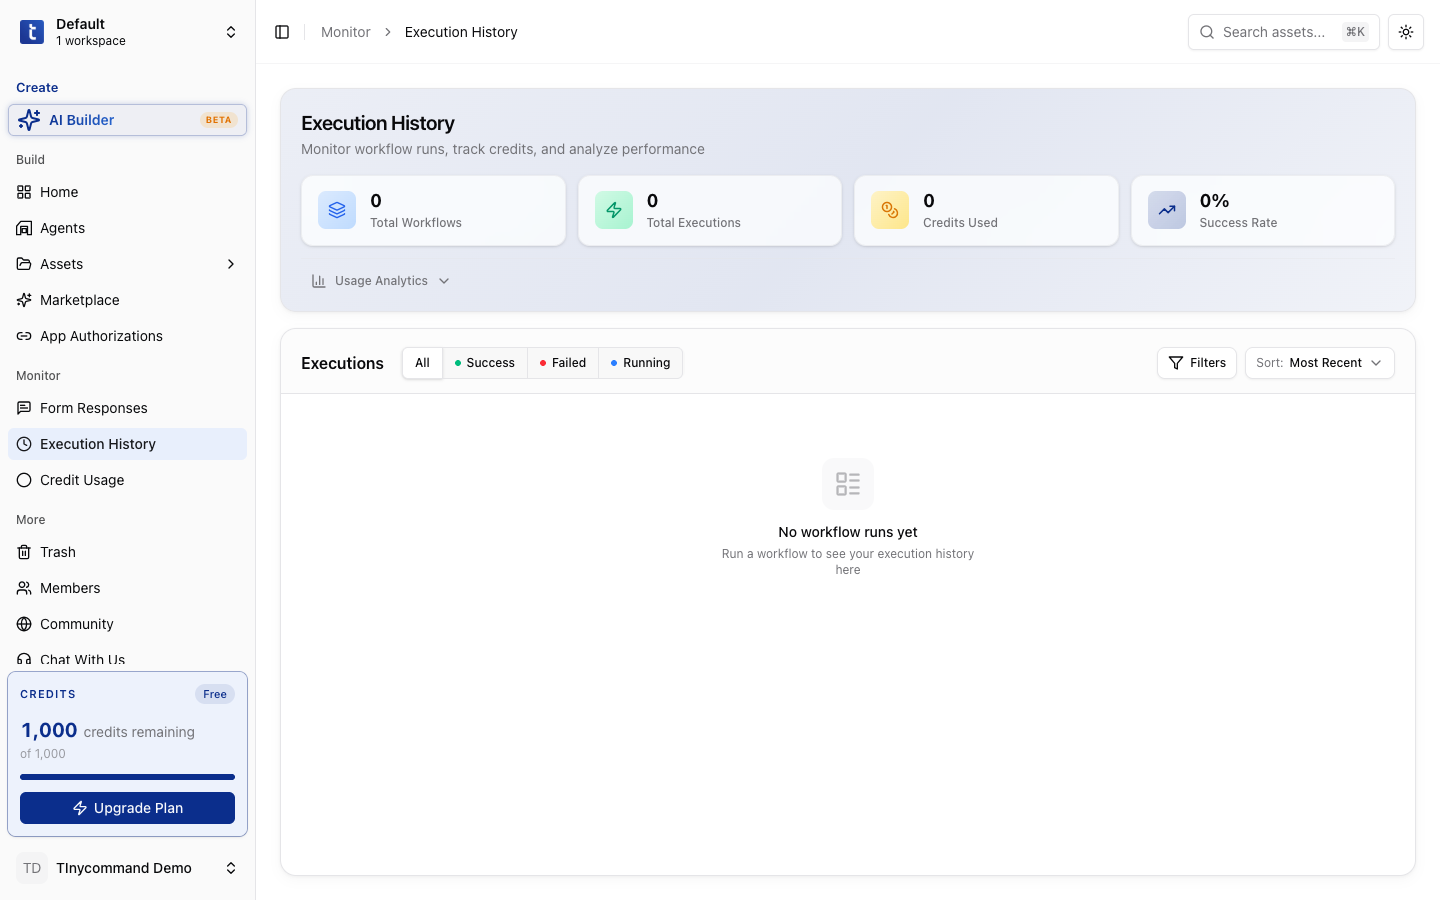
Each execution shows:
- Status: Success, Failed, or Running
- Triggered at: when the run started
- Duration: how long the run took
- Credits used: how many credits the run consumed
Click on any execution to see the per-node breakdown: every node's input, output, and timing.
Debugging common issues
Node shows red (failed)
- Click the failed node to see the error message
- Common causes:
- Connection expired: re-authorize in App Authorizations
- Missing field: a variable references a field that doesn't exist
- API error: the external service returned an error
- Timeout: the request took too long
Workflow doesn't trigger
- Check the trigger configuration: is the webhook URL correct? Is the schedule enabled?
- Check the Active toggle: the workflow must be published and active
- Check the execution history for any queued runs
Data looks wrong
- Click each node in the execution history to inspect its output
- Compare the actual output against what you expected
- Check variable references: a typo in
{{trigger.body.feild}}returns undefined
Tip
Use the Send Email to Yourself node as a quick debug tool. Add it after any node to email yourself the node's output and verify the data at each step.