Getting Started
This guide walks you through creating a table, adding columns, entering data, and using different views.
Create a table
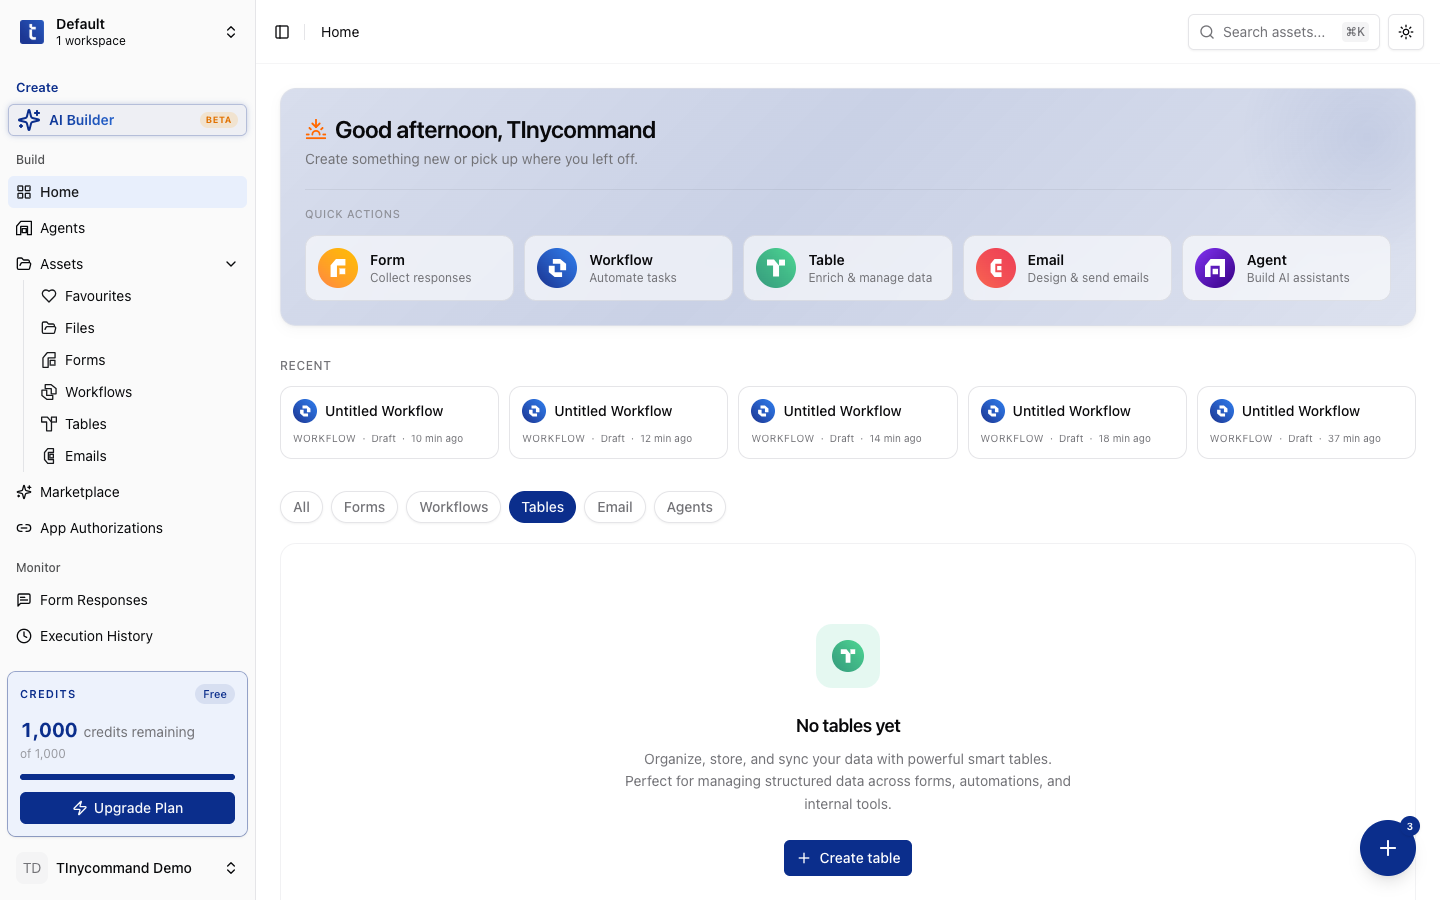
- Click Table in the Quick Actions, or go to Assets → Tables
- Choose a template (CRM Contacts, Sales Pipeline, Content Calendar, Project Tracker) or start empty
- You'll land in the Grid view, a spreadsheet-like interface
Add columns
Click the + button at the end of the column header row. Choose from 37 column types:
- Short Text: single line of text
- Number: numeric values with formatting
- Single Select: dropdown with color-coded options
- Date & Time: date picker with optional time
- File Upload: attach documents, images, files
- AI Column: AI-generated content based on a prompt and other columns
Each column has a configuration panel with options for name, type, default value, and type-specific settings.
Enter data
Click any cell to edit it. Type values directly, or use the field-specific editors:
- Select fields: click to open dropdown, pick from options or create new ones
- Date fields: click to open calendar picker
- File fields: click to open file upload dialog
- Rating fields: click stars/icons to set the value
Add rows
- Click + Add row at the bottom of the grid
- Or press Tab from the last cell to create a new row
Expand a record
Click the expand icon on any row to open the full record view: all fields displayed in a form layout with more space.
Switch views
Click the view tabs at the top to switch between views:
| View | Best for |
|---|---|
| Grid | Data entry, bulk editing, analysis |
| Kanban | Pipeline management (sales, projects) |
| Calendar | Date-based scheduling |
| Gallery | Visual items (products, portfolio) |
| Gantt | Project timelines with dependencies |
| Form | Per-record detailed editing |
Each view can have its own filter, sort, group, and hidden field settings; they don't affect other views.
Filter, sort, and group
Filter
Click the Filter button → add conditions → choose field, operator, and value. Nest conditions with AND/OR groups.
Sort
Click Sort → choose field and direction (ascending/descending). Add multiple sort levels.
Group
Click Group → choose a field to group by. Up to 3 levels deep. Groups can be collapsed/expanded.
Column statistics
Click the footer area below any column to see statistics:
| Function | Description |
|---|---|
| Count | Total number of rows |
| Filled | Rows with a value |
| Empty | Rows without a value |
| Sum | Total (numeric columns) |
| Average | Mean value |
| Min / Max | Lowest / highest value |
| Range | Max minus Min |
| Median | Middle value |
AI features
AI Column
Add an AI-powered column that generates content for each row:
- Add a new column → select AI Column
- Write a prompt (e.g., "Summarize this company based on {name} and {description}")
- Select source columns the AI should reference
- Choose a model tier (Nano=1 credit, Mini=5, Pro=10, Max=20)
- Generate; the AI fills each cell
AI Chat
Click the AI chat icon to open the conversational sidebar. Ask questions about your data:
- "How many deals are in the pipeline?"
- "Filter for records created this week"
- "Group by status and show totals"
The AI can apply filters, sorts, and groups automatically.
Comments
Click the comment icon on any row to add threaded comments. Features:
- Reply to specific comments
- Emoji reactions (6 types)
- Edit/delete your own comments
Import and export
- CSV Import: click Import → upload a CSV file → map columns
- CSV Export: click Export → select columns → download
Start with a template if you're new. CRM Contacts or Project Tracker give you a pre-built structure with the right column types already configured.
TinyTables is embeddable. You can embed a table view into any website using the embed URL from the share settings.