Filtering & Sorting
TinyTables has a powerful filtering system with nested conditions, per-type operators, and multi-field sorting.
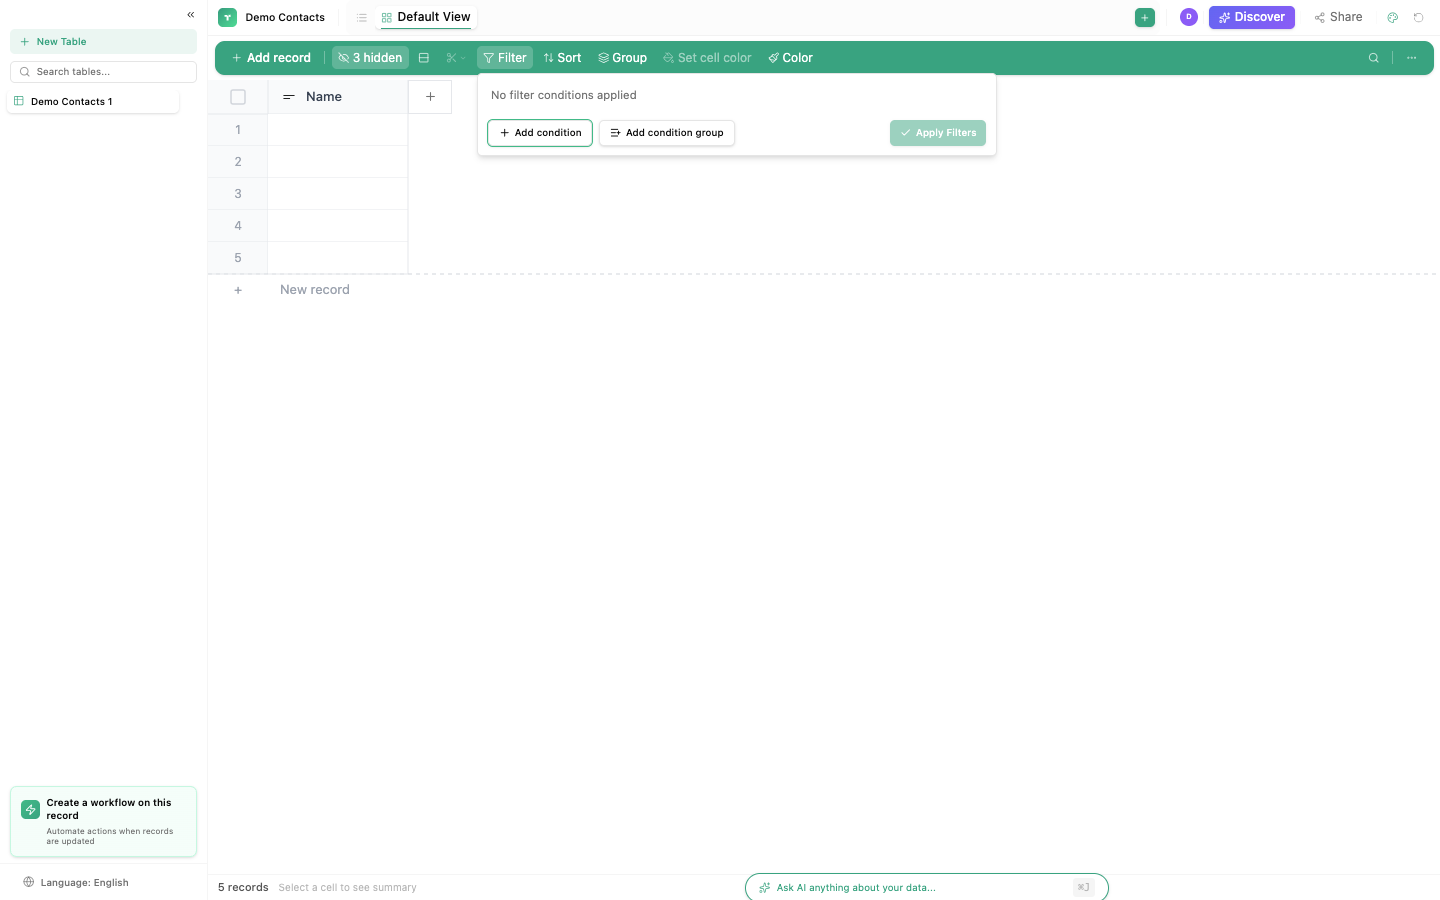
Filtering
Click the Filter button in the toolbar to add conditions.
Filter structure
Filters use nested AND/OR groups:
WHERE
  (status = "Active" AND plan = "Enterprise")
  OR
  (status = "Trial" AND created_at > "2026-01-01")
Operators by column type
| Column type | Available operators |
|---|---|
| Text | contains, does not contain, equals, starts with, ends with, is empty, is not empty |
| Number | equals, greater than, less than, greater than or equal, less than or equal, is between, is empty |
| Date | is before, is after, is between, is empty, is today, is this week, is this month |
| Single Select | equals, does not equal, is empty |
| Multi Select | includes, does not include, is empty |
| Checkbox | is checked, is not checked |
| Yes/No | is yes, is no, is empty |
| Rating | equals, greater than, less than |
Adding a filter
- Click Filter in the toolbar
- Choose a field from the dropdown
- Choose an operator
- Enter a value (or select from options for Select fields)
- Click + Add condition for additional conditions
- Choose AND or OR to combine conditions
- Click + Add group for nested condition groups
Sorting
Click Sort to order rows by one or more fields.
Multi-field sorting
Add multiple sort levels. The first level is primary, additional levels break ties:
| Level | Field | Direction |
|---|---|---|
| 1 | Status | Ascending (Active → Closed → Trial) |
| 2 | Created Date | Descending (newest first) |
| 3 | Name | Ascending (A → Z) |
Grouping
Click Group to visually group rows by a field value.
| Feature | Description |
|---|---|
| Levels | Up to 3 nesting levels (e.g., Group by Status → then by Region → then by Plan) |
| Collapse | Click group headers to collapse/expand |
| Count | Each group header shows the record count |
| Server-side | Grouping is computed on the server for performance |
Column statistics
Click the footer area below any column to see aggregate statistics:
| Function | Works with | What it shows |
|---|---|---|
| Count | All types | Total rows |
| Filled | All types | Rows with a value |
| Empty | All types | Rows without a value |
| % Filled | All types | Percentage of non-empty rows |
| Unique | Text, Select | Number of distinct values |
| Sum | Number, Currency | Total of all values |
| Average | Number, Currency, Rating | Mean value |
| Min | Number, Currency, Date | Lowest value |
| Max | Number, Currency, Date | Highest value |
| Range | Number, Currency | Max minus Min |
| Median | Number, Currency | Middle value |
Conditional coloring
Color rows or cells based on field values:
- Right-click a column header → Conditional coloring
- Set a condition: field + operator + value
- Choose a color (8 options available)
- Matching rows/cells get the background color
Use this to visually highlight important records: overdue tasks in red, high-priority items in yellow, completed items in green.
Per-view settings
Each view has its own filter/sort/group settings. Changing filters in the Grid view doesn't affect the Kanban view. This means you can have:
- Grid view: all records, sorted by date
- Kanban view: filtered to active records, grouped by status
- Calendar view: filtered to records with dates, no grouping
Save commonly used filter combinations as separate views. Create a "My Tasks" view filtered to your name, an "Overdue" view filtered to past-due dates, etc.